Everything it does
The full list, for when you want the detail. Items marked Pro need a license key; everything else is in the free download.
What it does
One app, two ways to run it: a desktop download for your own computer, or a Docker image for a home server or a £5/month VPS your team can reach.
Network health at a glance
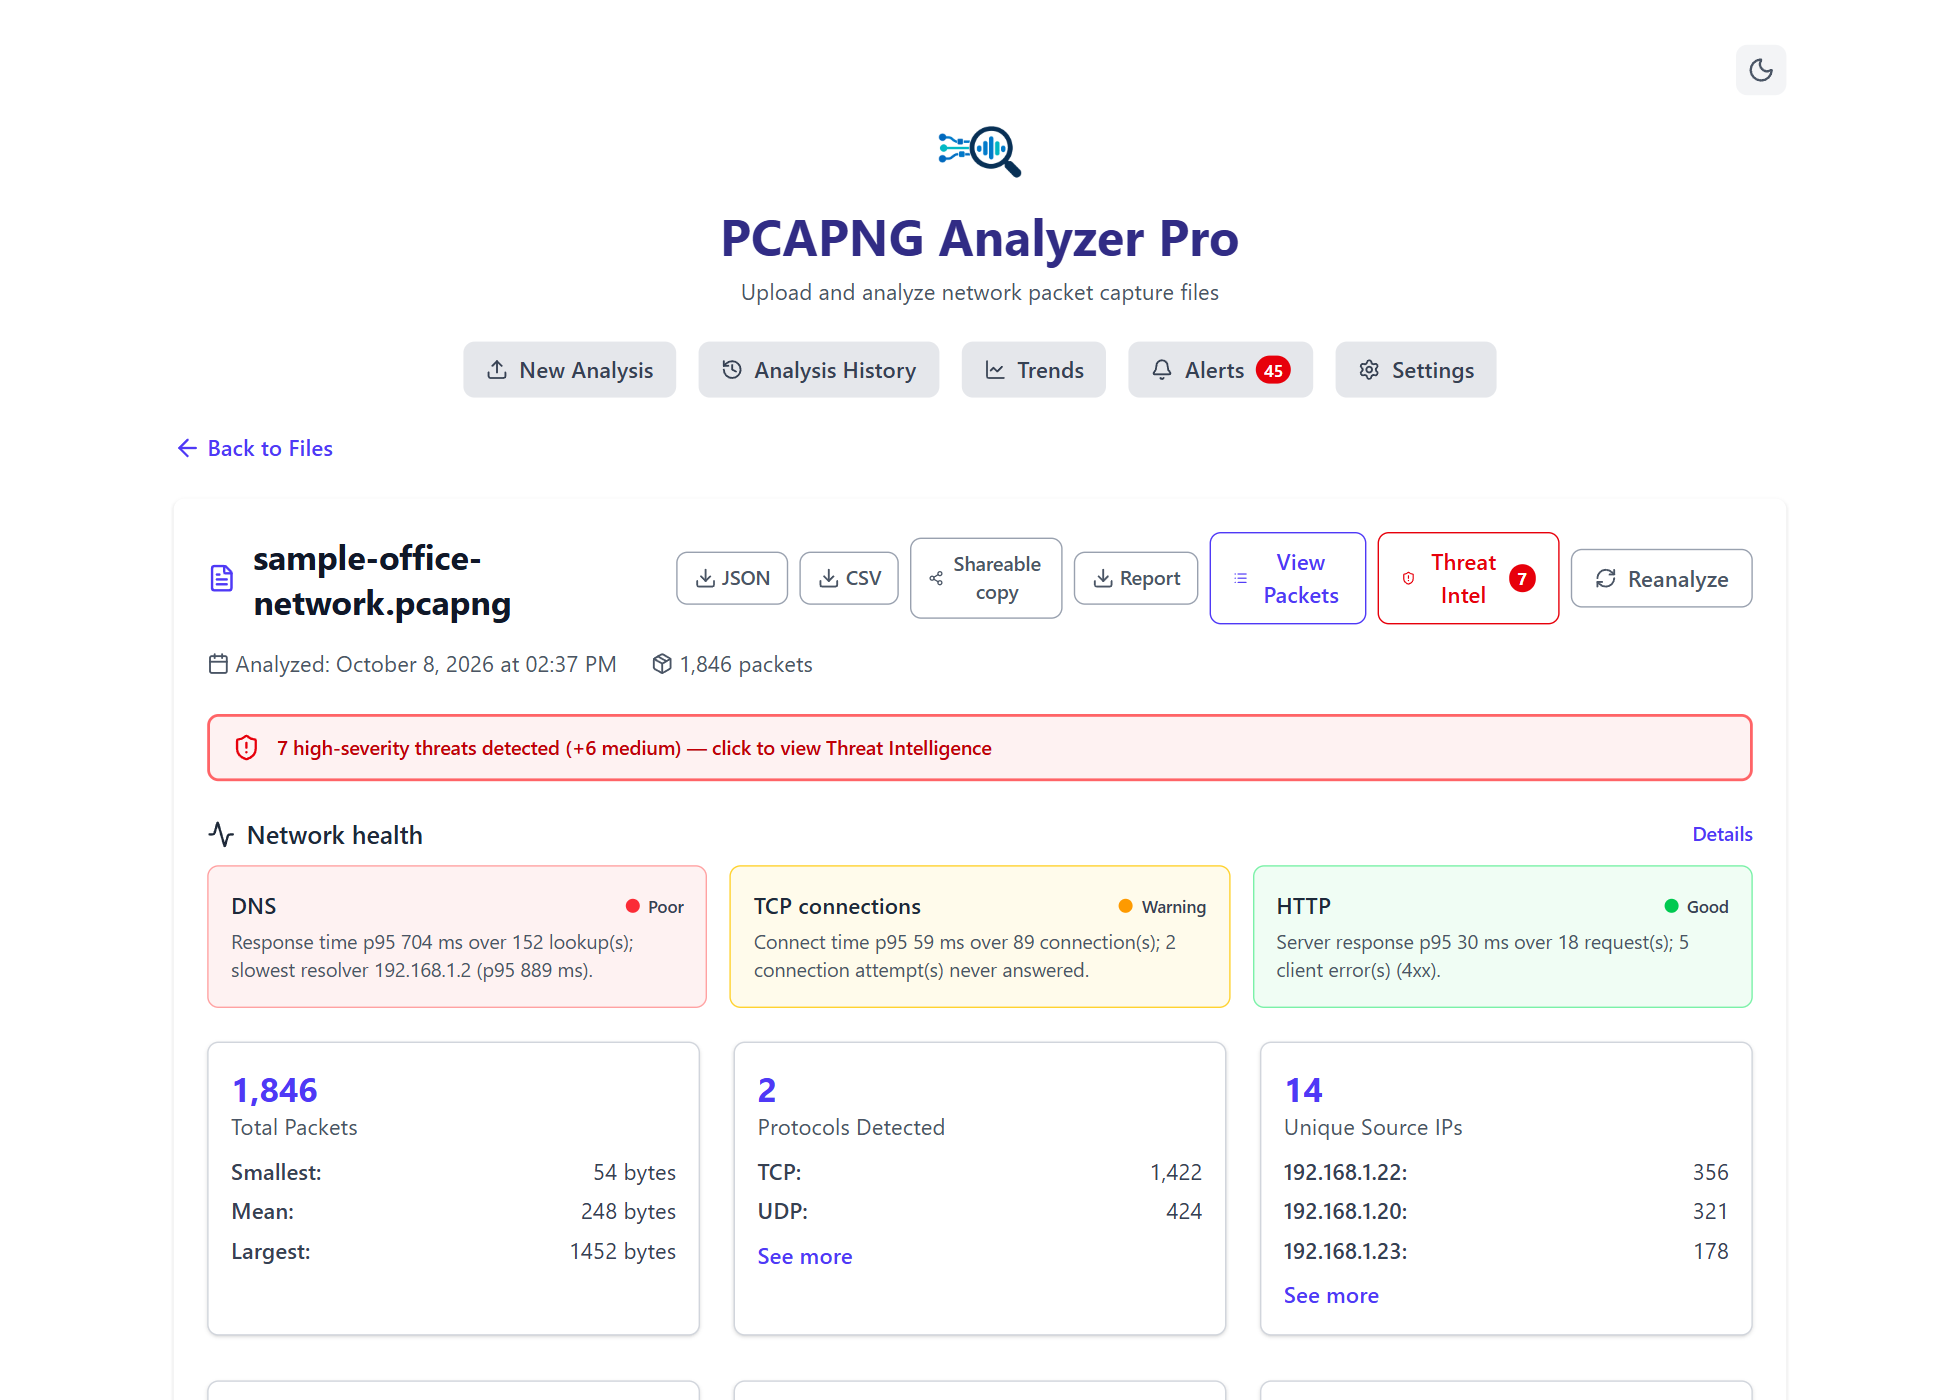
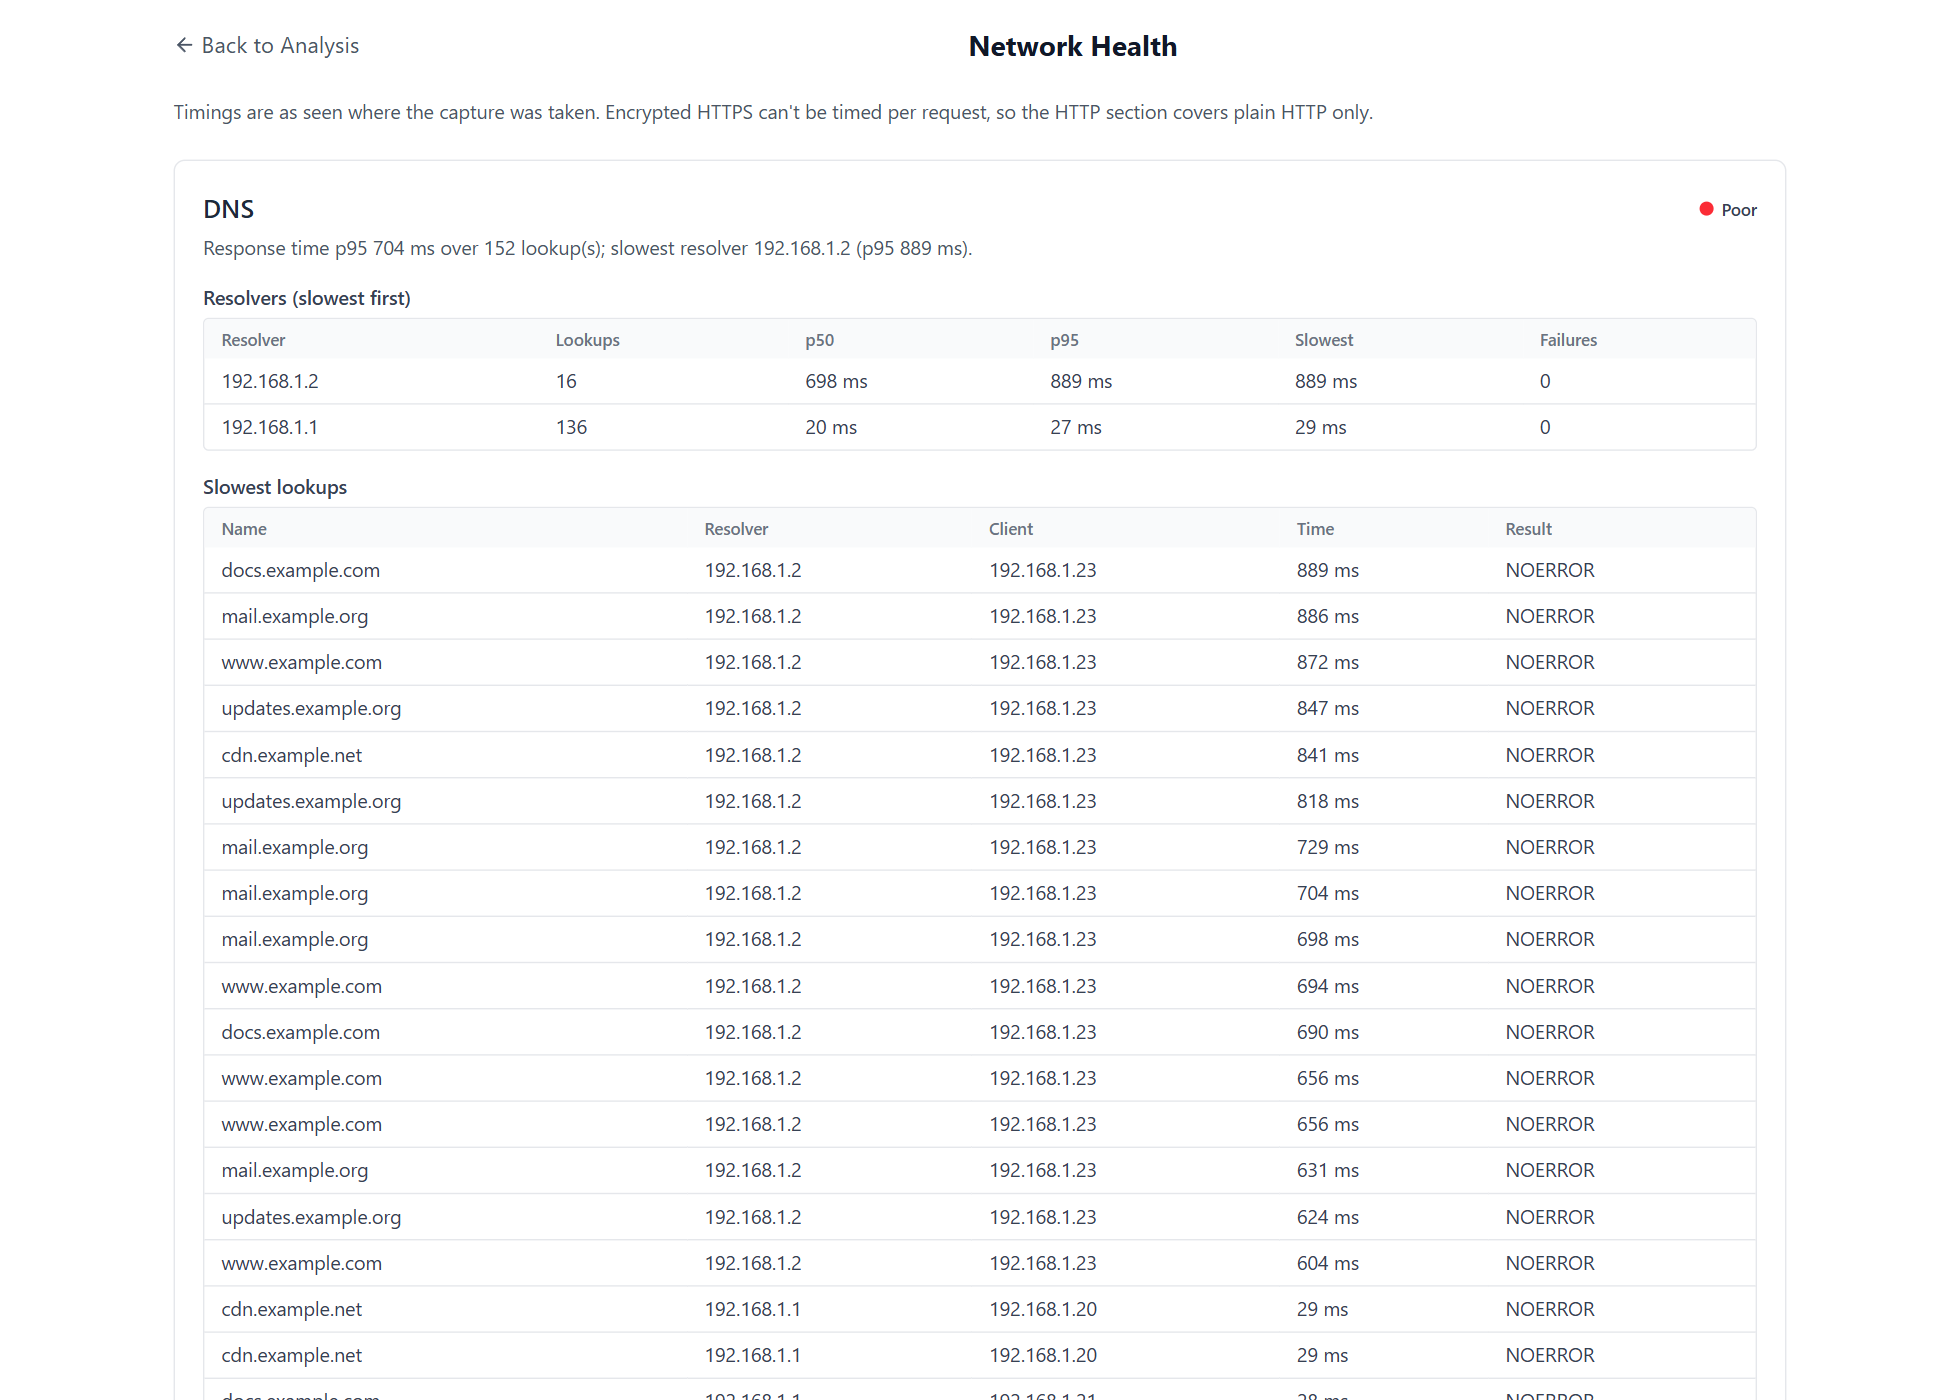
DNS response times per resolver, TCP connect times, unanswered connections, retransmissions and HTTP server response times, each rated good, warning or poor, with the worst offenders named. Free shows the summary and the worst three of each; Pro shows the full lists and what got worse between two captures.
44 kinds of finding, explained
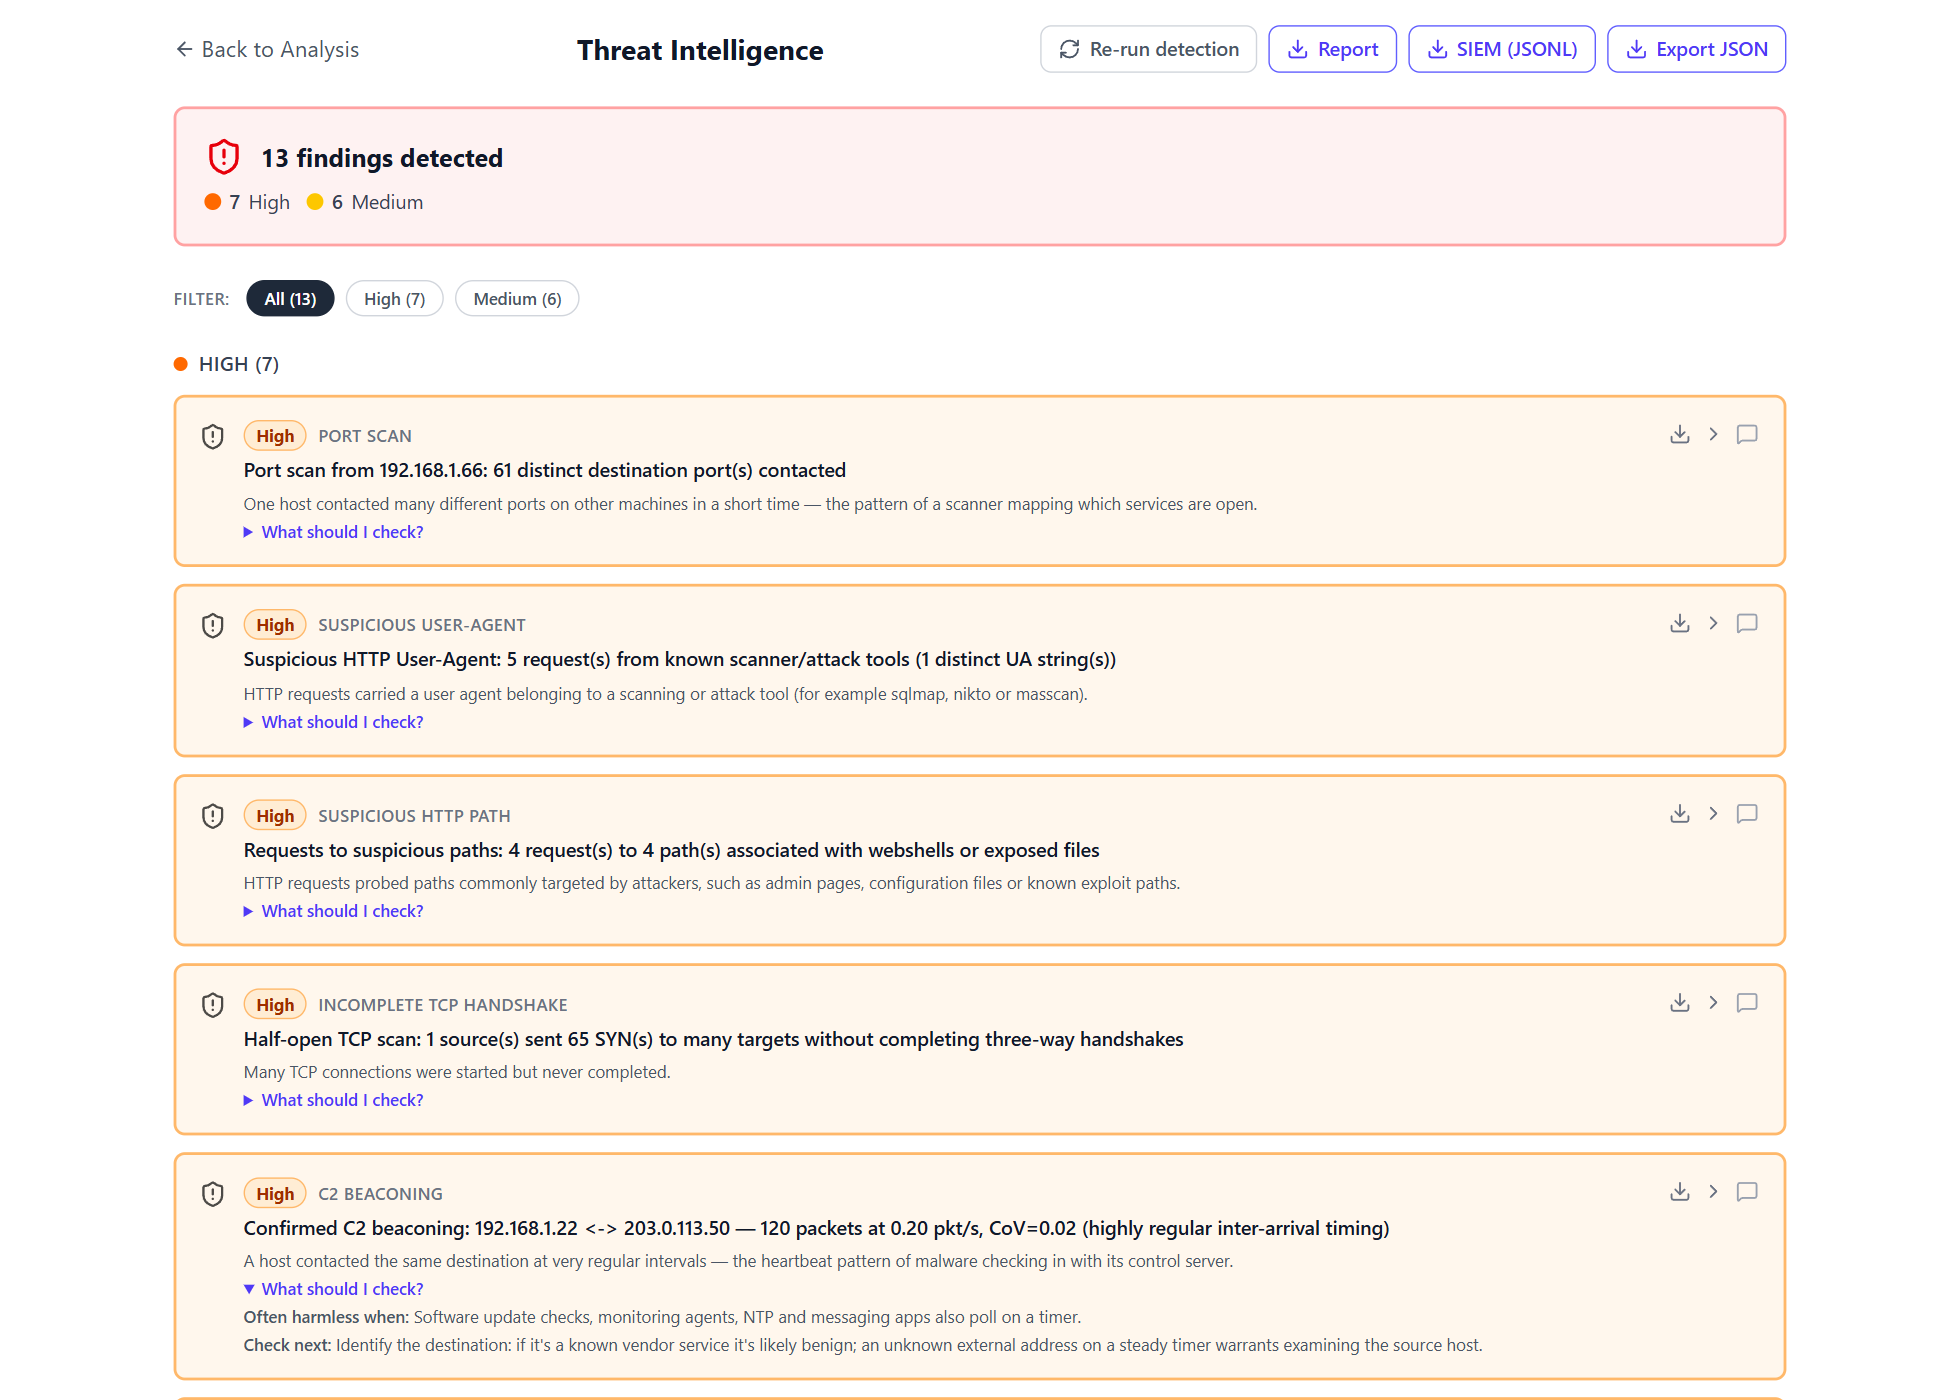
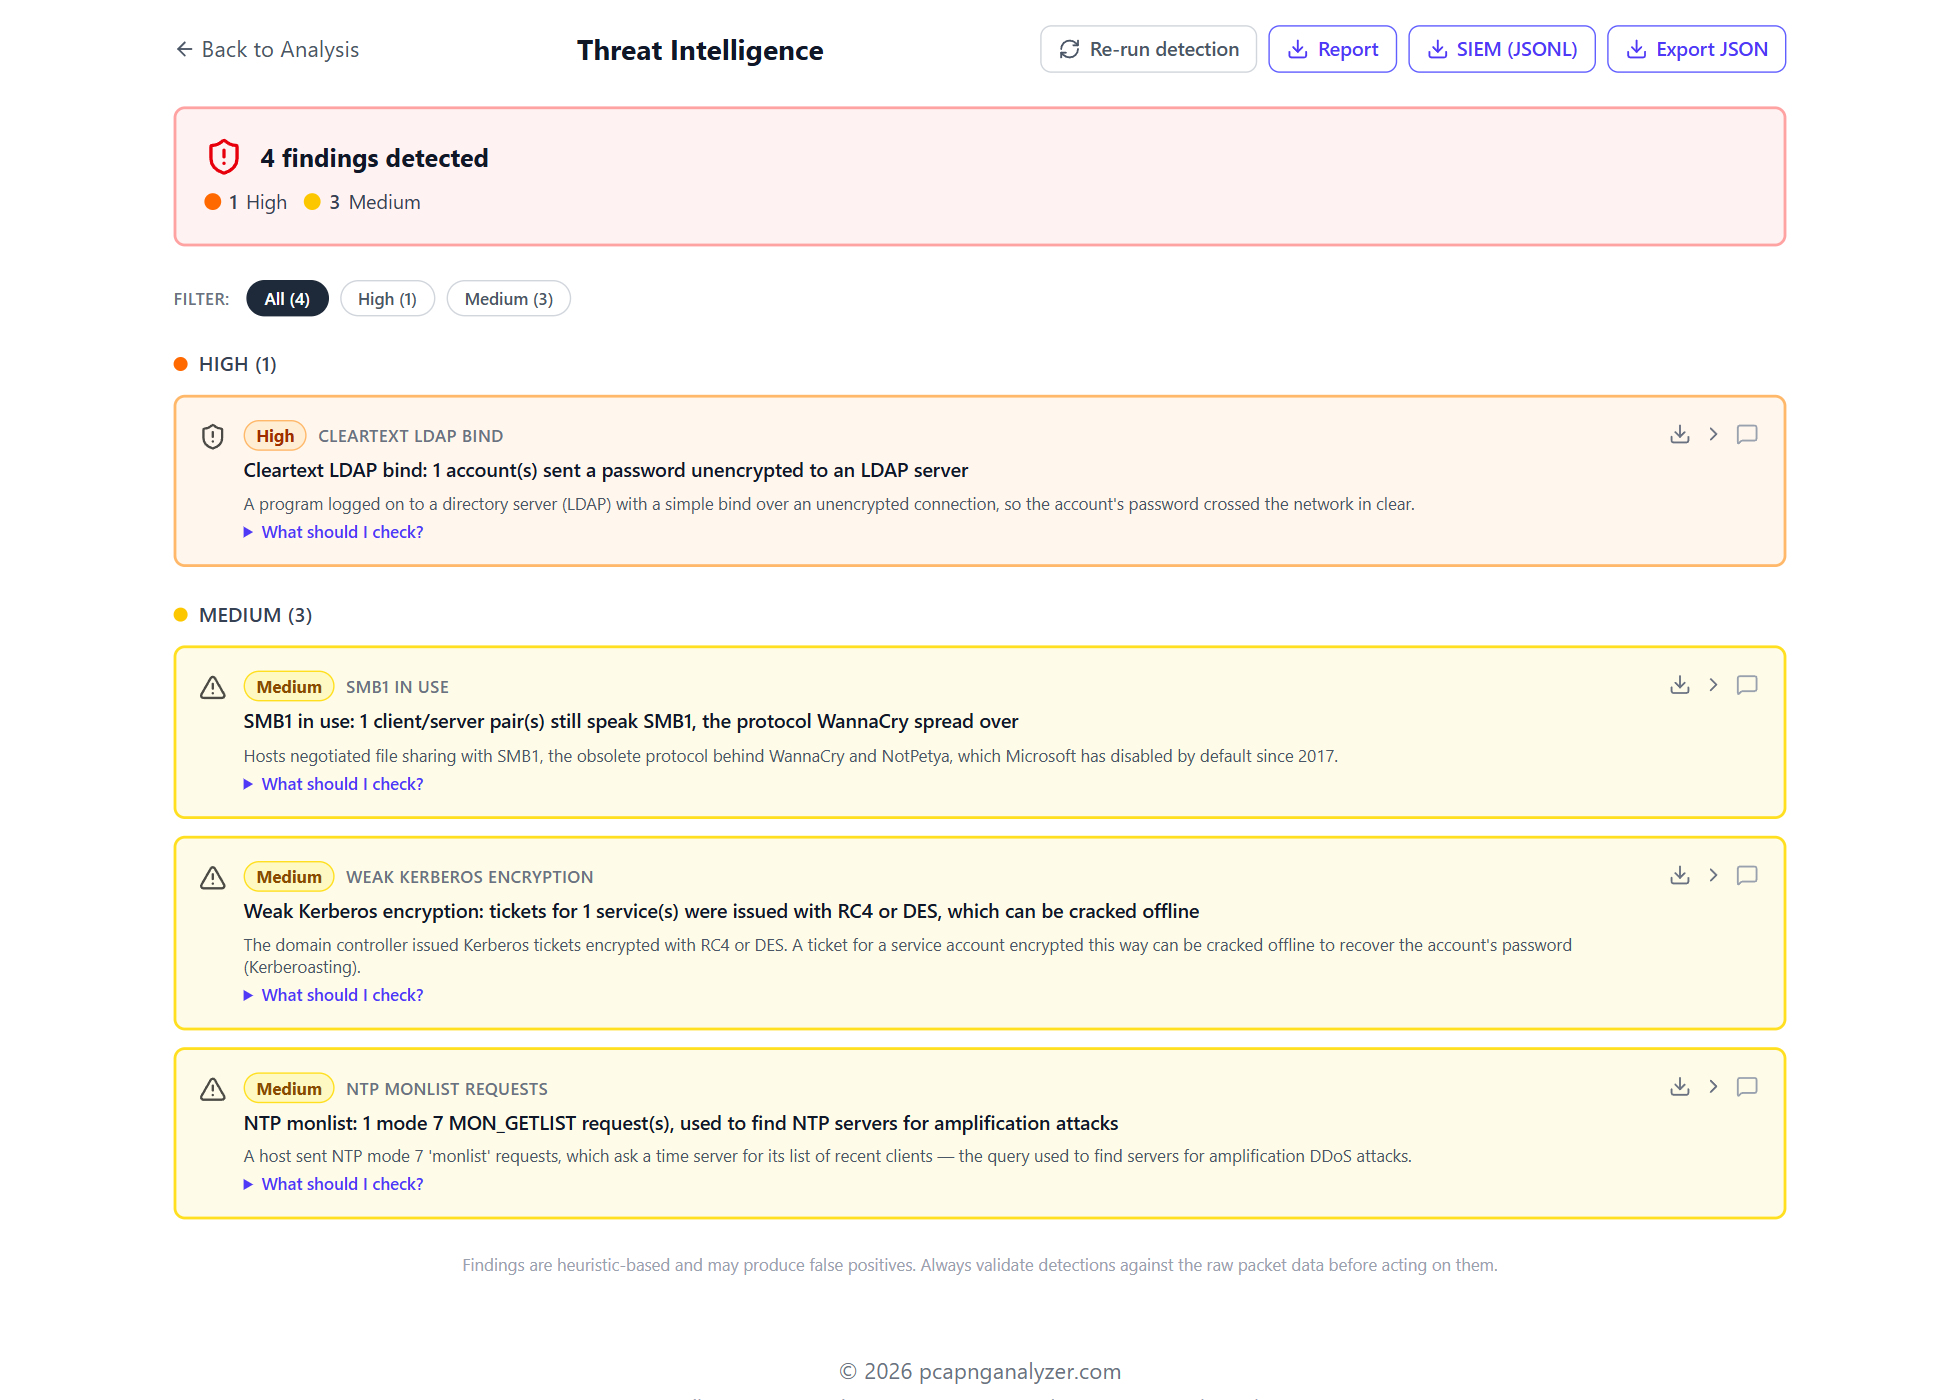
Port scans, beaconing, DNS tunnelling, cleartext passwords, weak Kerberos tickets, SMB1 and more. Each finding says what it means, when it's usually harmless and what to check next, and you can mark it confirmed or a false positive. Free shows a preview of what was found. Pro.
Trends and “first seen”
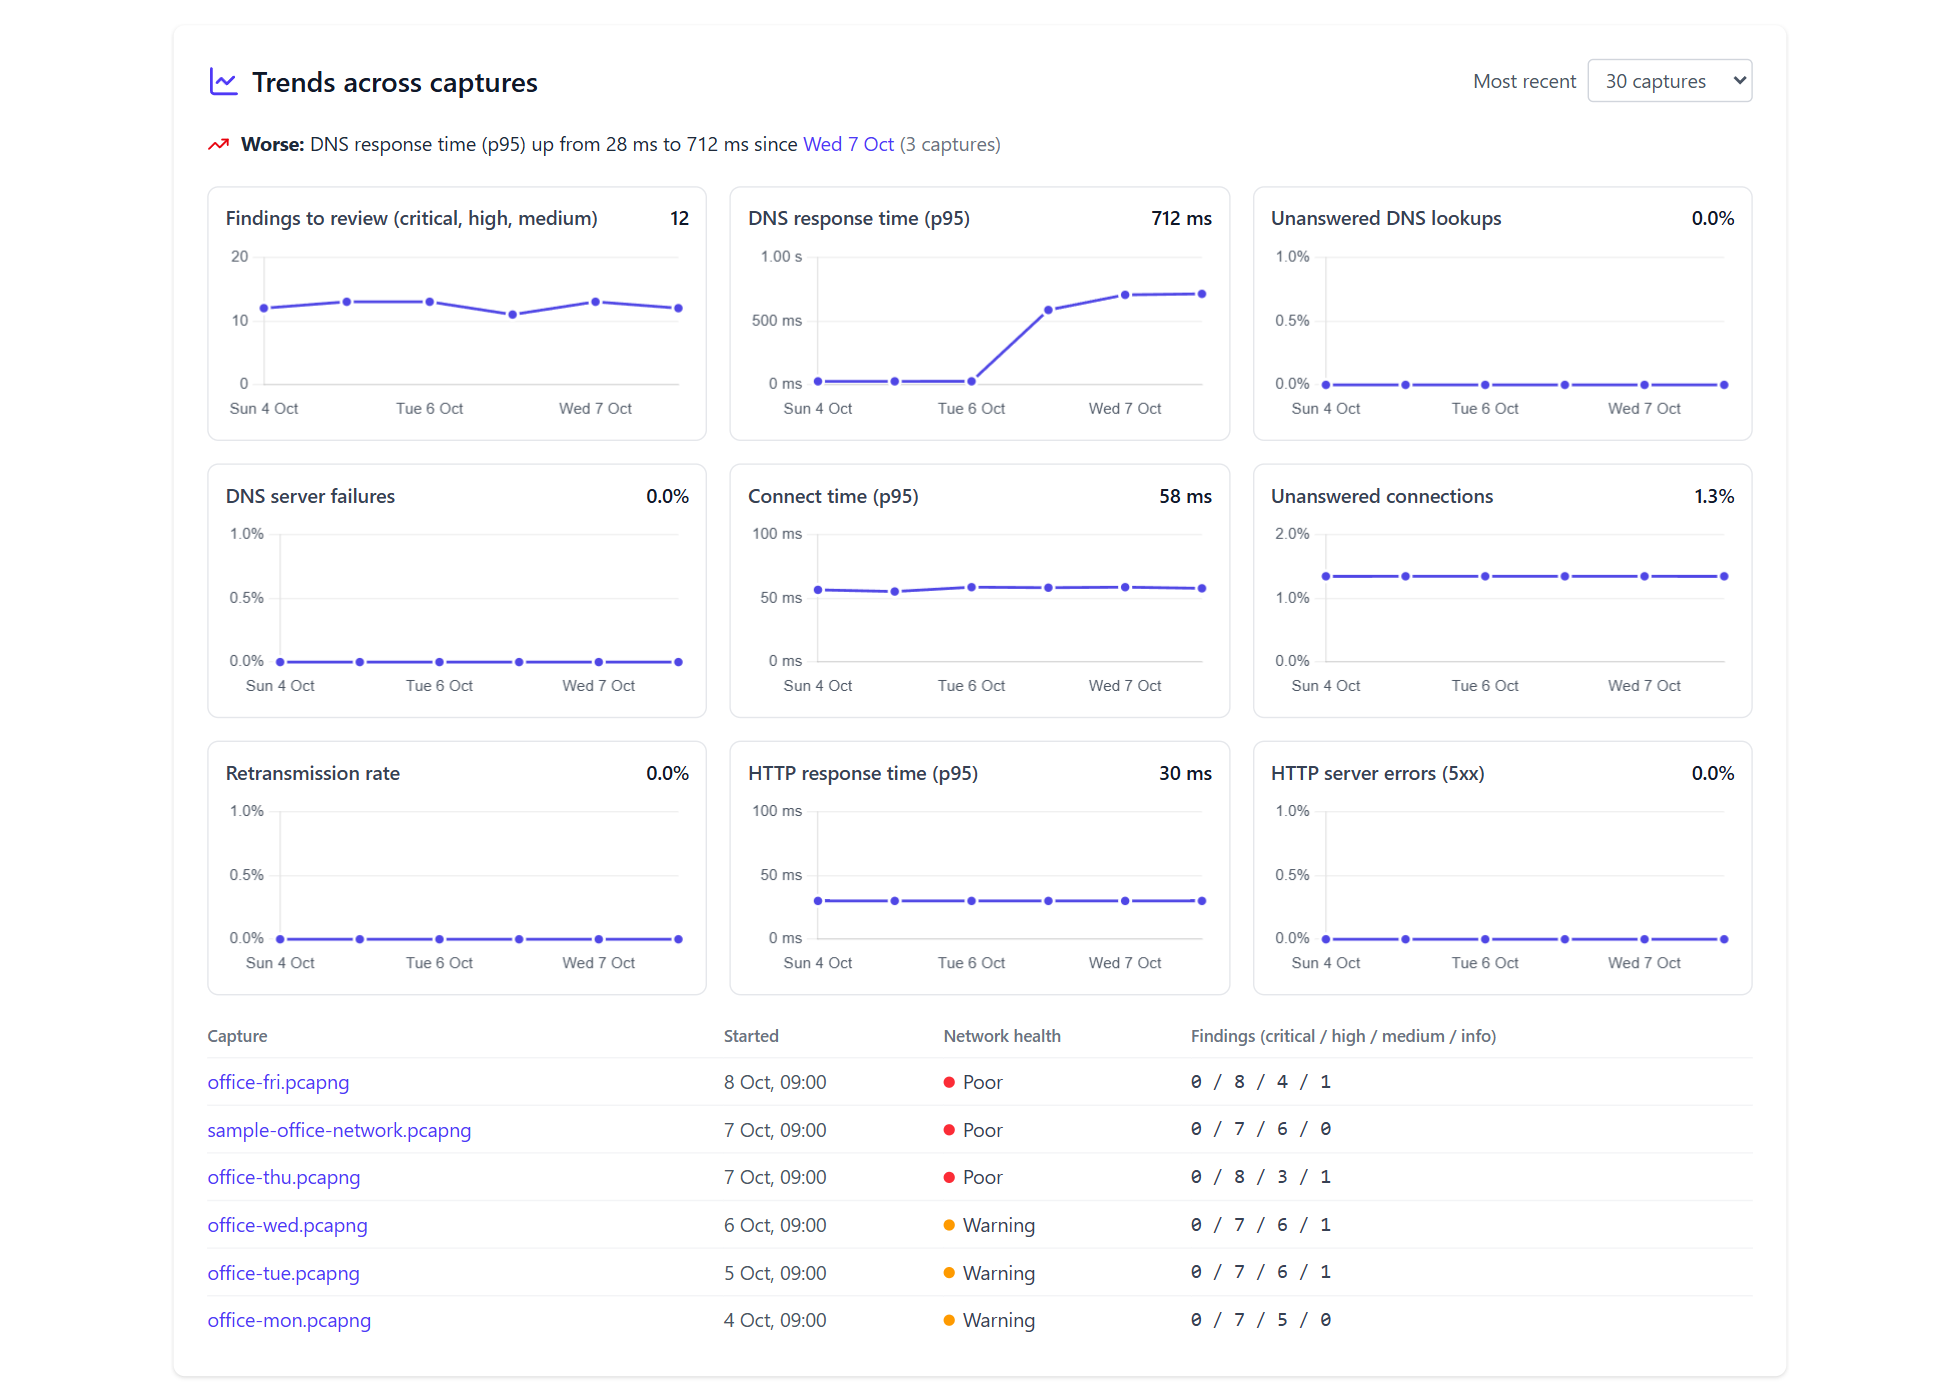
Health and findings across your captures over time, such as “DNS response time up from 28 ms to 712 ms since Wednesday”. It also flags hosts, domains, certificates and ports your network has never used before. Click any address to see every capture it appears in. Pro.
Incident reports
One click makes a self-contained report that opens with an executive summary: the verdict, network health, what needs attention and what was checked and found clean. It can carry your company name, logo and a case reference. Pro. See a sample.
Your own threat intel
Import lists of IPs, ranges, domains, file hashes and JA3, JA4 or HASSH fingerprints. Every capture is checked against them: traffic, DNS lookups, TLS and QUIC server names, HTTP hosts and files. Lists are imported locally and never leave your server. Pro.
Follow streams, extract files
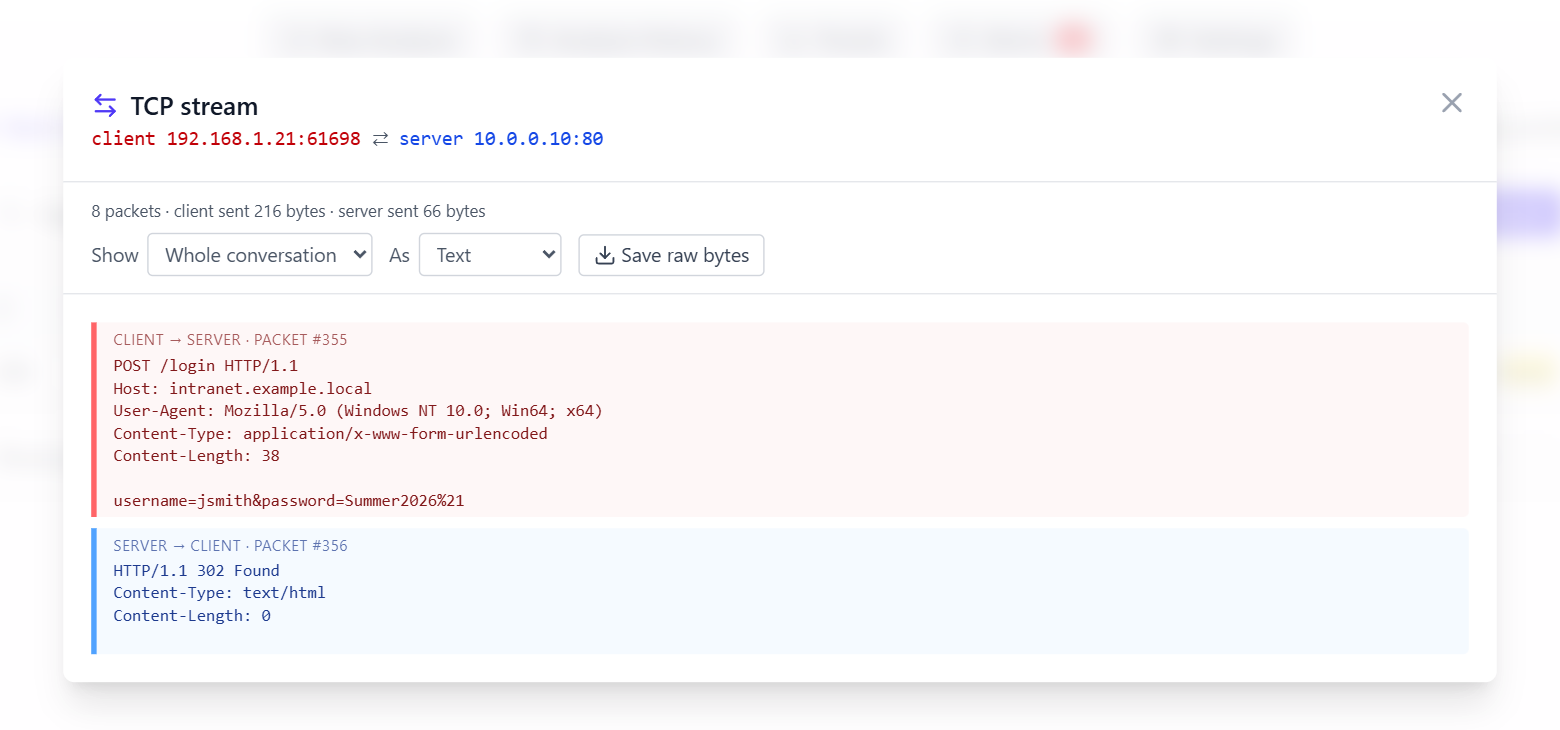
Open any TCP or UDP conversation as the text or bytes each side sent, and save the raw data. Pro also lists every file sent or received over HTTP, with its SHA-256 hash, any threat list it's on and a download.
Broad protocol decode
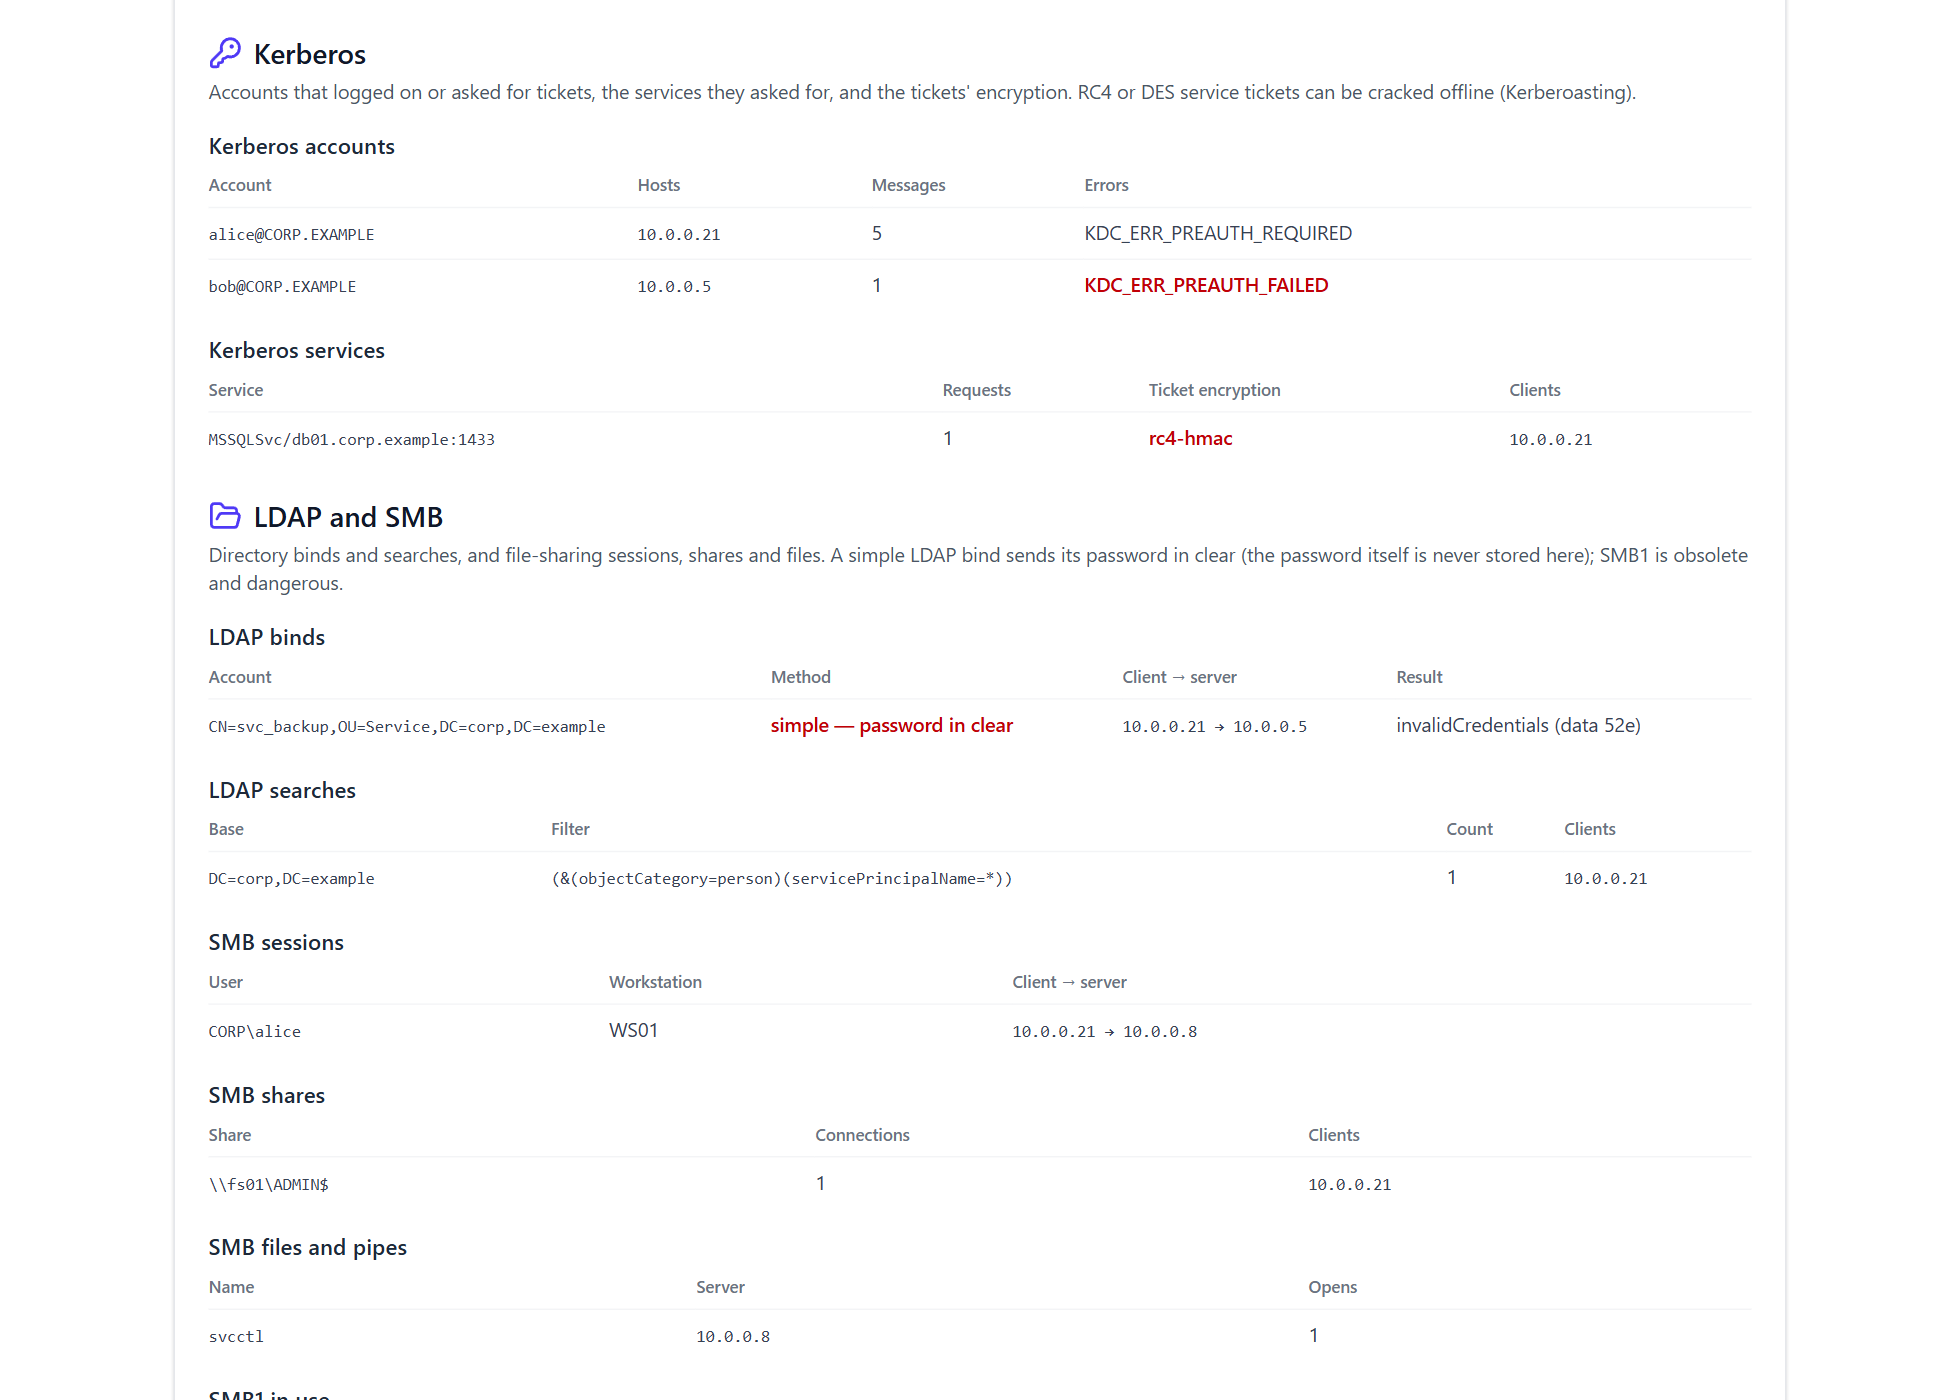
Ethernet, IPv4/IPv6, ARP, TCP, UDP, ICMP, DNS, HTTP and TLS with certificate details. Also QUIC, whose Initial packets it decrypts for server names. Plus DHCP, SSH, Kerberos, LDAP, SMB and NTP, and JA3/JA4 client fingerprints. The devices and services view lists what it found.
Automate it
Drop captures into a watched folder and they're analyzed on arrival. You get local alerts for serious findings, findings for your SIEM as JSON Lines and API tokens for scripts. You can also re-run detection over your whole history. Pro.
Batch, compare and share safely
Analyze up to 20 files at once and diff two captures. With Pro, you can make a shareable copy of a capture for a vendor: payloads stripped, and addresses replaced consistently.
See it in action
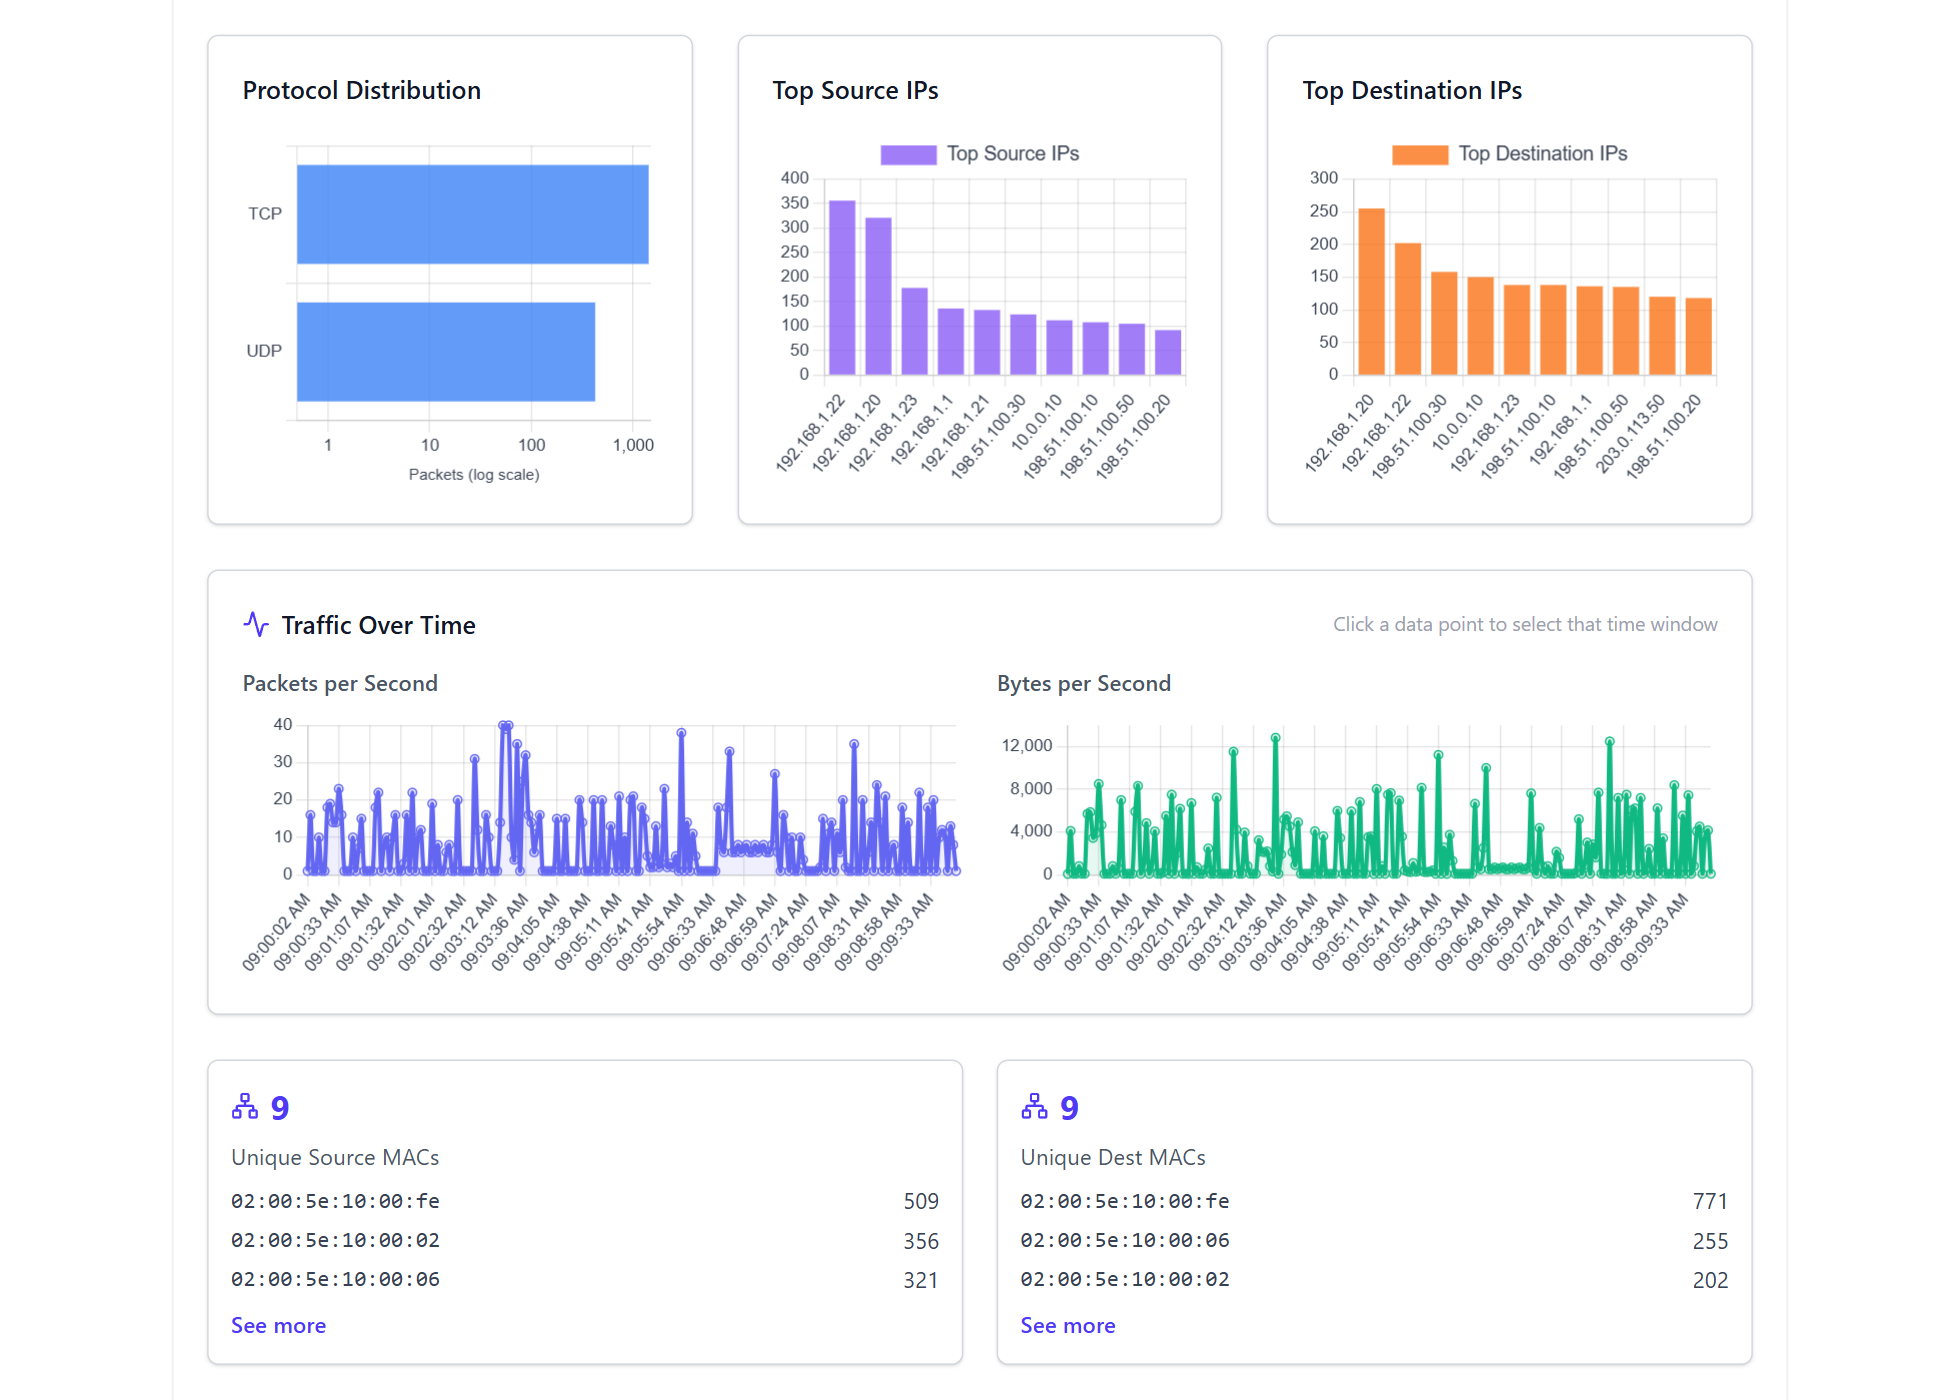
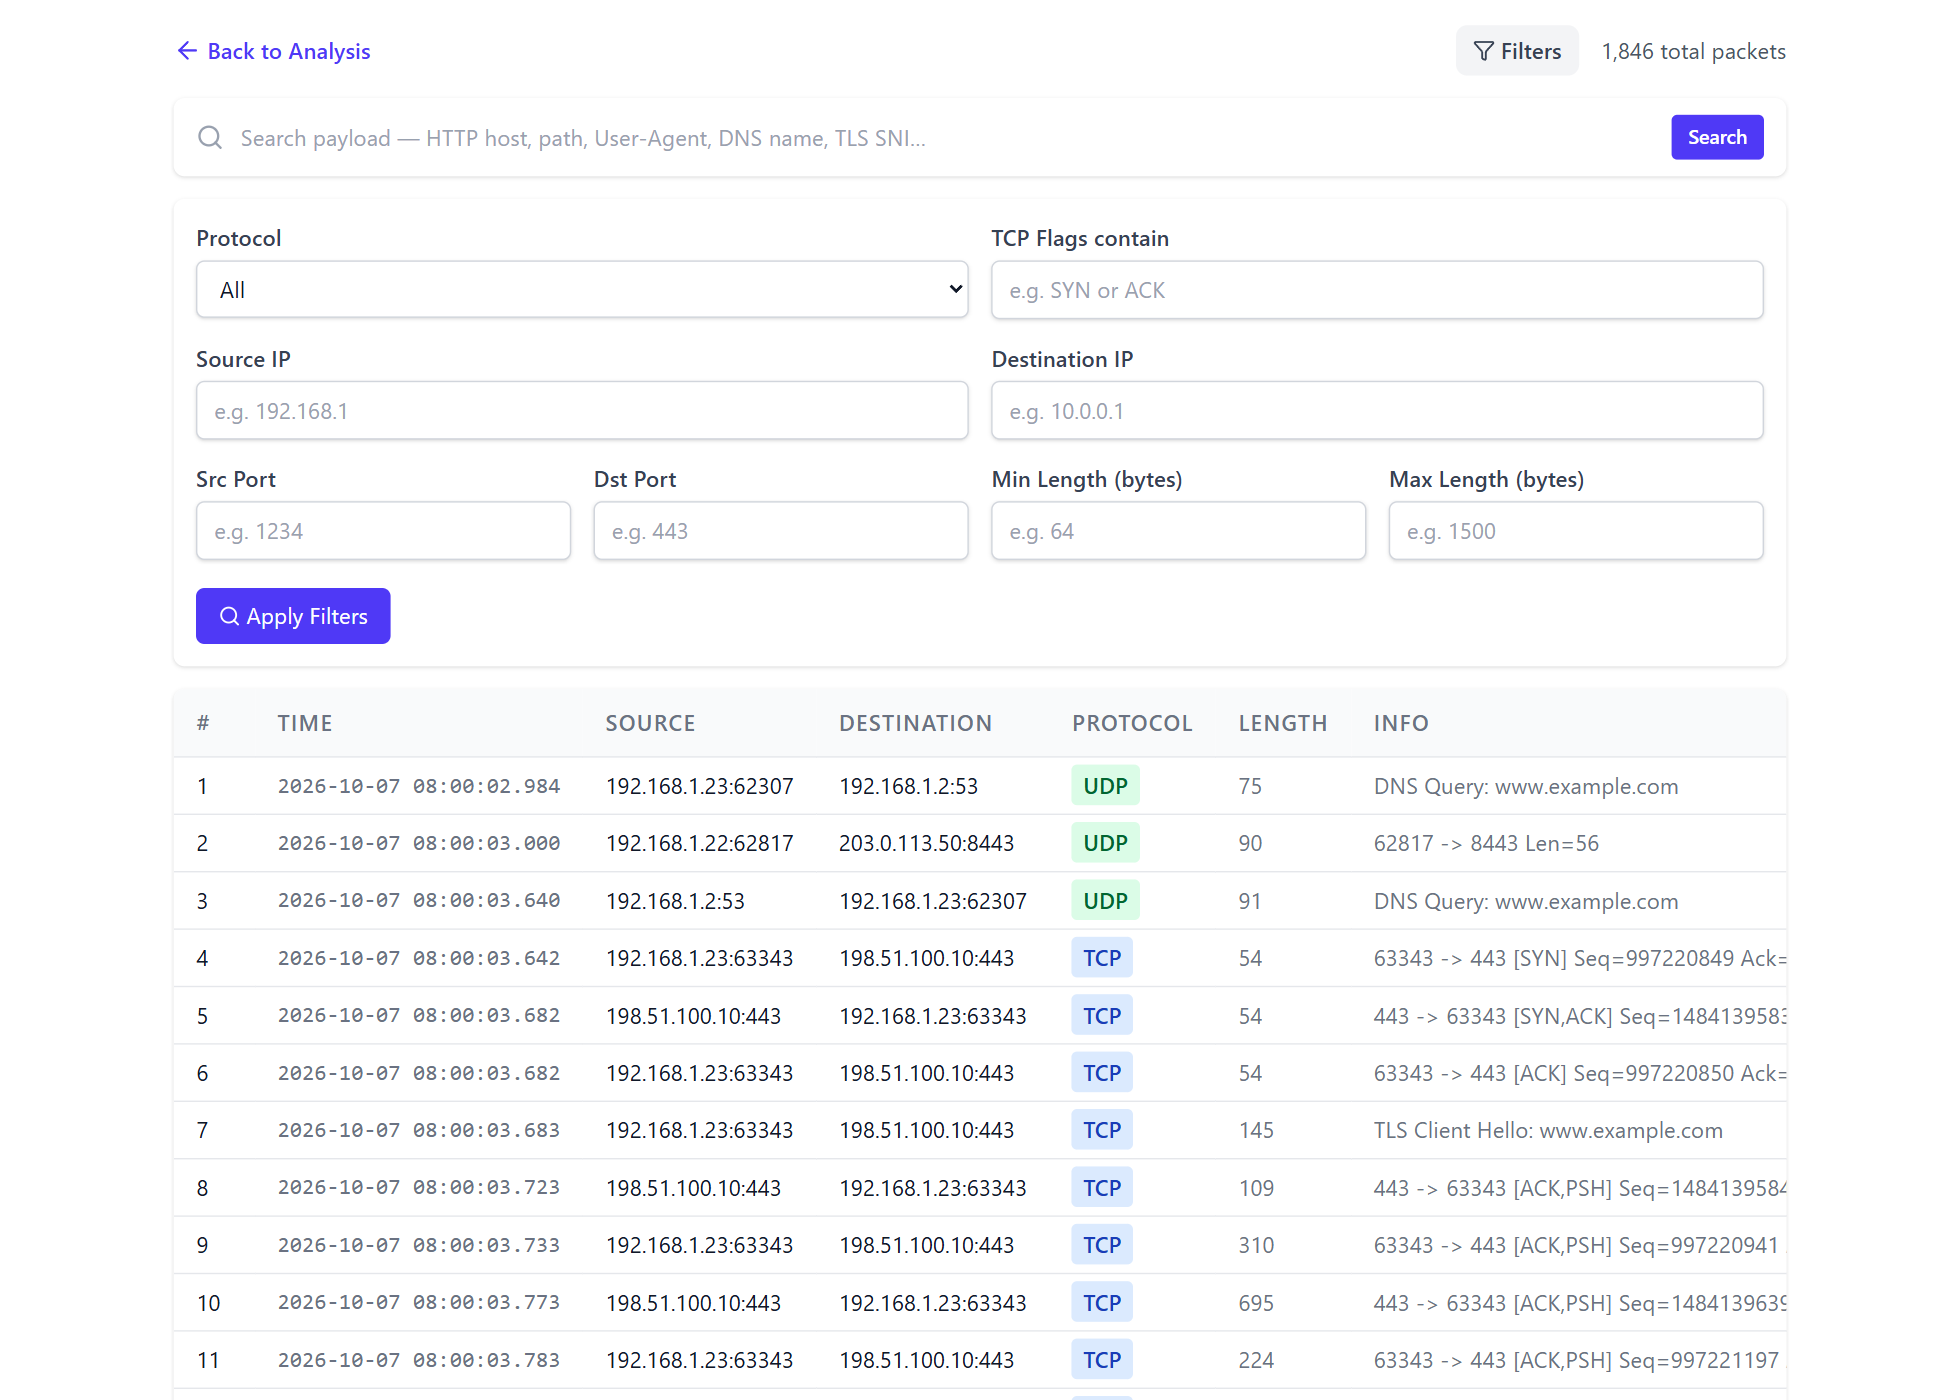
Real output from the synthetic office captures that ship with the app - no real network data. Click any screenshot to zoom in.
Free vs Pro, at a glance
Full breakdown, and the 14-day free trial, on the pricing page.
| Capability | Free | Pro |
|---|---|---|
| Decode, aggregate analysis, follow stream, devices & services | Included | Included |
| Network health | Summary & worst three | Full, plus before/after |
| 44 kinds of finding, with explanations | Preview | Included |
| Trends, first-seen and entity timeline | - | Included |
| Your own IOC lists & history re-scan | - | Included |
| Incident reports with executive summary & branding | - | Included |
| Watched folder, alerts, SIEM export & API tokens | - | Included |
| Upload size cap | 1000 MB | 5120 MB |
| History retention | 25 items | Unlimited |
Try it on your own capture
Free on Windows, macOS and Linux. Running it for a team? Use the Docker setup.